Procedures
Mass
Length
Amplitude
- Determine a starting mass and its center of mass
- Release pendulum from same amplitude
- Wait to start timer after 5 periods
- Stop timer after 10 periods
- Take average of 3 times and divide by 10 to find period
- Add more mass and determine the new center of mass (this was not done)
- Adjust length of string to keep length constant (this was not done)
- Repeat steps 2-7 ten times
Length
- Determine starting length with a constant mass
- Release pendulum from same amplitude
- Wait to start timer after 5 periods
- Stop timer after 10 periods
- Take average of 3 times and divide by 10 to find period
- Lengthen pendulum by 0.01 m
- Repeat steps 2-6 ten times
Amplitude
- Determine starting amplitude while keeping mass and length
- Release pendulum from determined amplitude
- Wait to start timer after 5 periods
- Stop timer after 10 periods
- Take average of 3 times and divide by 10 to find period
- Increase amplitude by 0.1 m
- Repeat steps 2-6 ten times
Mass
|
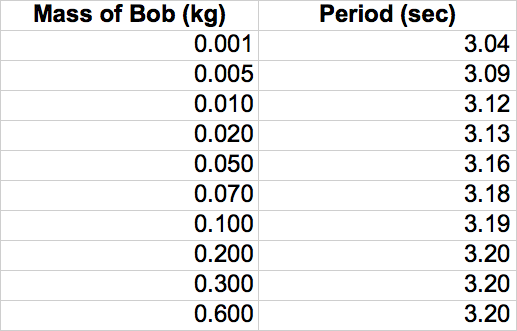
The graph of Period vs. mass shows us that as mass increases, period increases. However, this is inaccurate. We did not account for the center of mass when mass was being added on, so length was changing inadvertently. Mass should have no effect on period.
|

|
Length
|
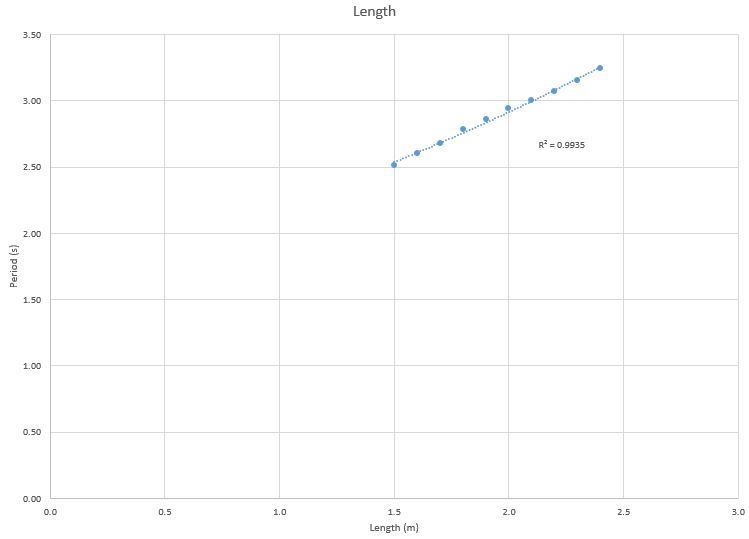
From the period vs. length graph, it can be determined that as length increases, period increases. This is correct, but the graph should be in the form y=sqrt(x).
The data shows a linear progression instead of an exponential progression. However, we sampled from a very small bunch of numbers, which doesn't completely represent the entire square root graph. Our "line" (which is tangent to the curve of the square root graph) is a small portion of the square root graph. Testing with more data points would have yielded the desired graph. 
|
|
Determining g from graph
To determine g, we must look at the relationship between the sqrt(length) and period. Below is a graph of period vs sqrt(length)

|
Since the slope of the above graph (linear) is defined as
Slope = 2pi/(sqrt(g)), then we know g is defined as g = (2pi/slope)^2 When we plug in the slope of the line, g = (2pi/1.9975)^2, we get g = 9.89 m/s^2 which is relatively close to the accepted value for g |

***Note period is slightly different from above data. This is due to the fact we are taking it vs. the sqrt(length). The formula for period typed into excel is shown below:

G38 = corresponding sqrt(length) value
|
Amplitude
|
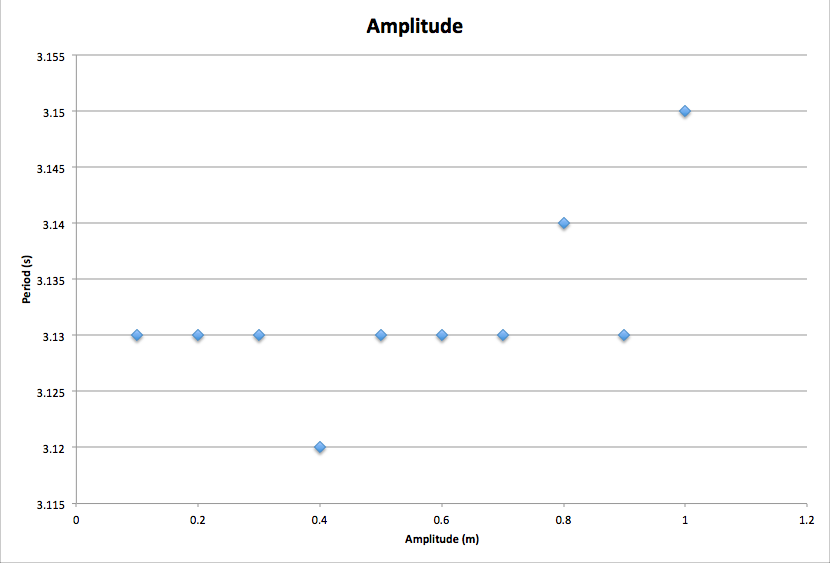
The graph of period vs. amplitude does not really tell us much. However, looking at a table of the data points can tell us what exactly is happening.
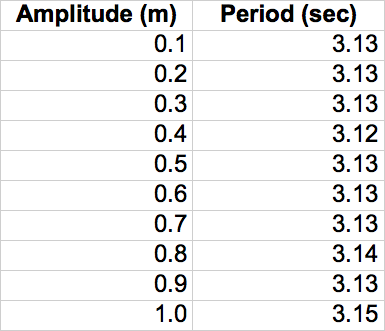
As amplitude gets bigger, there is significant change in period (despite a few outliers). This goes along with the equation for period of a simple pendulum WITH SMALL ANGLES; amplitude is not in the equation which means it has no effect on the period.
If the amplitude is significantly larger, the period will slightly change, but not in great amounts. 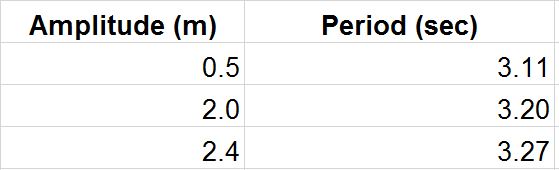
|
|
